1、plt.text()函数
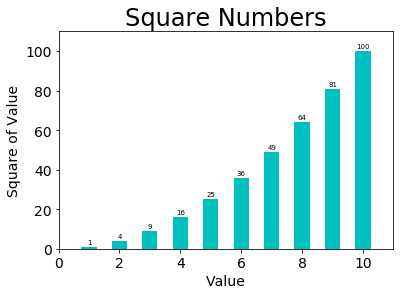
#创建带数字标签的直方图
numbers = list(range(1,11))
#np.array()将列表转换为存储单一数据类型的多维数组
x = np.arange(1,11)
y = x**2
plt.bar(x,y,width=0.5,align='center',color='c')
plt.title('Square Numbers',fontsize=24)
plt.xlabel('Value',fontsize=14)
plt.ylabel('Square of Value',fontsize=14)
plt.tick_params(axis='both',labelsize=14)
plt.axis([0,11,0,110])
for a,b in zip(x,y):
    plt.text(a,b+1,'%.0f'%b,ha = 'center',va = 'bottom',fontsize=7)
plt.savefig('imagessquares.png')
plt.show()
2、plt.annotate()函数
#plot()绘制折线图
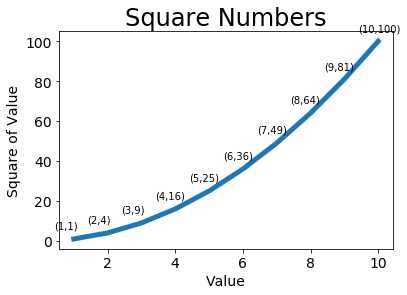
plt.plot(x,y,linewidth=5)

#annotate()给折线点设置坐标值
for a,b in zip(x,y):
    plt.annotate('(%s,%s)'%(a,b),xy=(a,b),xytext=(-20,10),
                 textcoords='offset points')
#设置标题
plt.title('Square Numbers',fontsize=24)
plt.xlabel('Value',fontsize=14)
plt.ylabel('Square of Value',fontsize=14)
#设置刻度的大小,both代表xy同时设置
plt.tick_params(axis='both',labelsize=14)
#show()打开matplotlib查看器,并显示绘制的图形
plt.show()
两个函数的用法还可以进一步参考:https://tyne.cc/215.html
 泰恩数据
泰恩数据


